Histograms
The graph view has a histogram mode. It shows how long a feed spent at each value, or how much energy was used at each power level.
This example uses a heat pump power feed.
Open a histogram
Open the feed in the graph view and choose the time window.
In Feed Config, click Histogram on the feed.
Set Type and Resolution.
For a more detailed result, use a shorter interval. Each request is limited to 70,000 datapoints by default.
Time at value
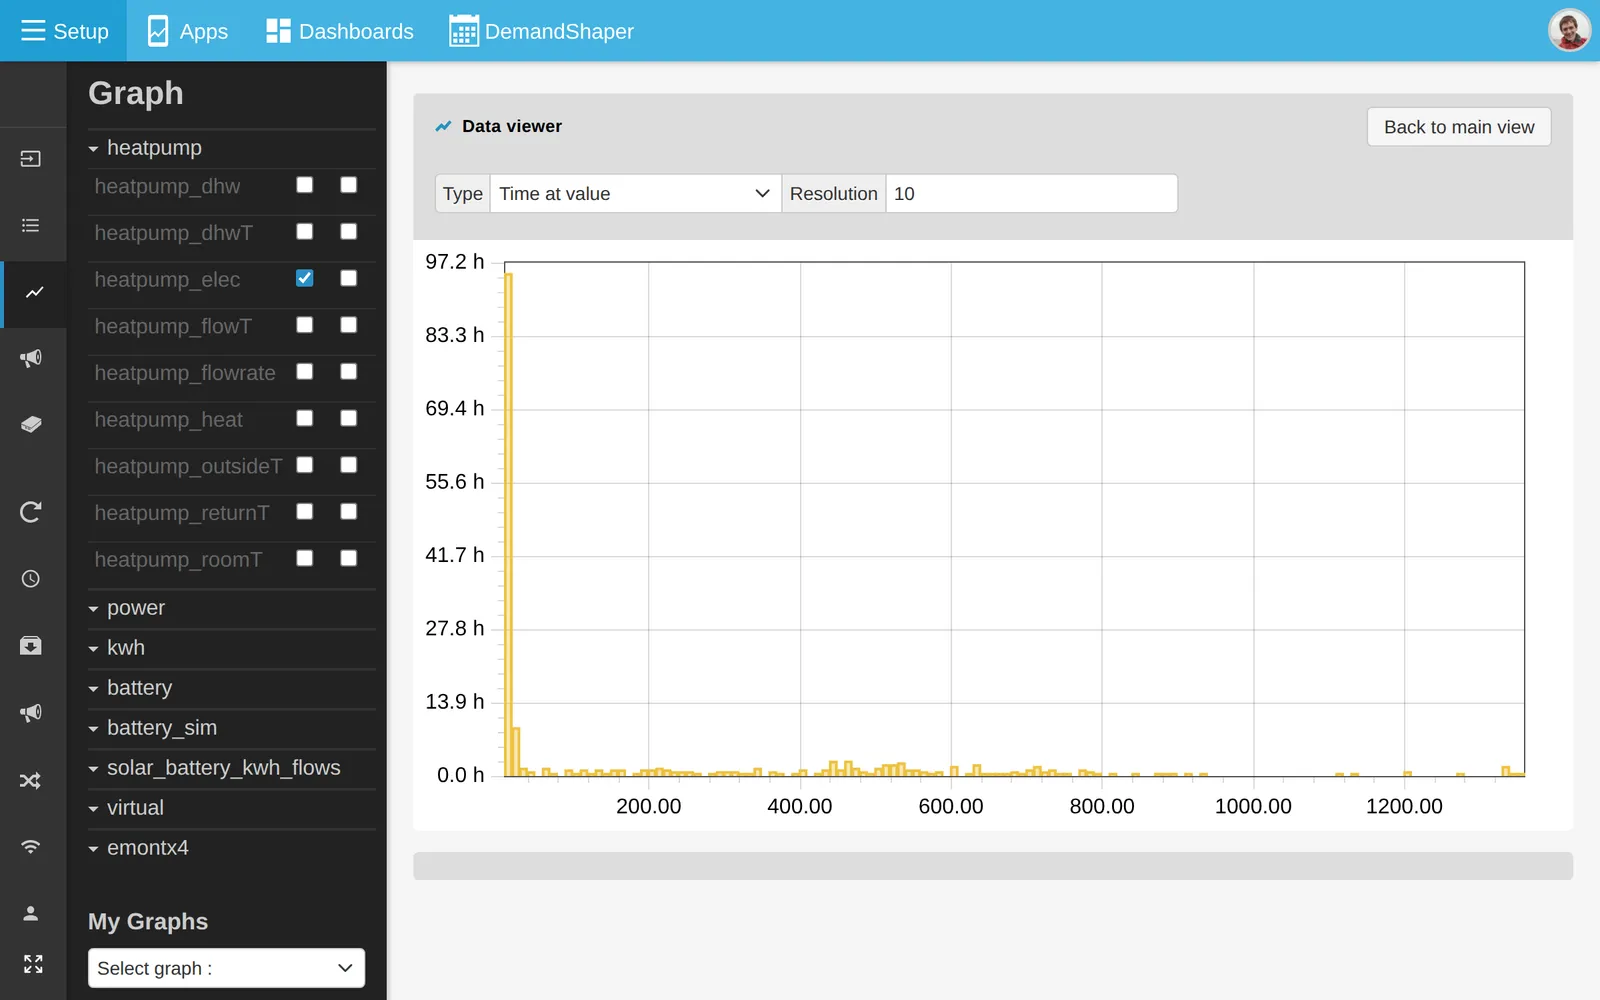
Time at value shows the time spent in each range of values.
In this example the heat pump spent about 1,123,200 seconds between 0 and 50 W, out of 2,592,000 seconds in the window. It was on standby 43% of the time.
kWh at Power
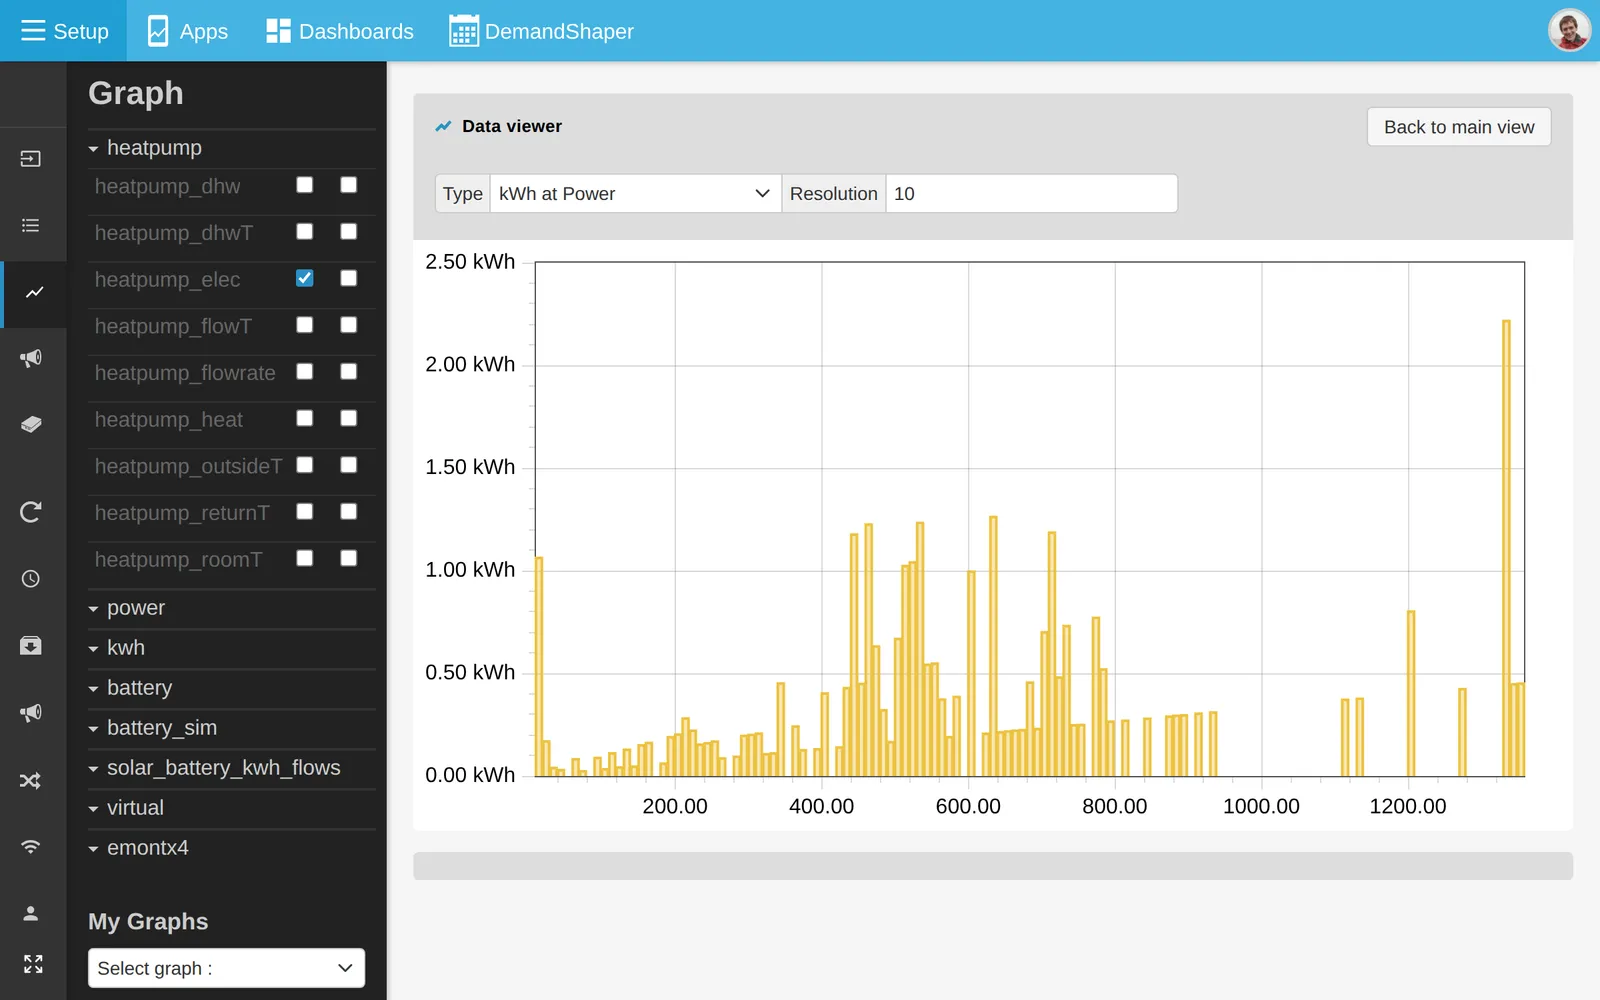
kWh at Power shows the energy used or generated in each power range. Use a power feed in watts.
In this example most of the heat pump’s energy, 97 kWh, was used between 500 and 549 W.